
Long-Run Trends in Earnings, Income, and Wealth Inequality
This page traces long-run changes in earnings, income, and wealth. It compares how rapidly these resources have grown, examines the role of asset prices in the rise of wealth, and documents how inequality has changed over time.
Earnings, income, and wealth growth
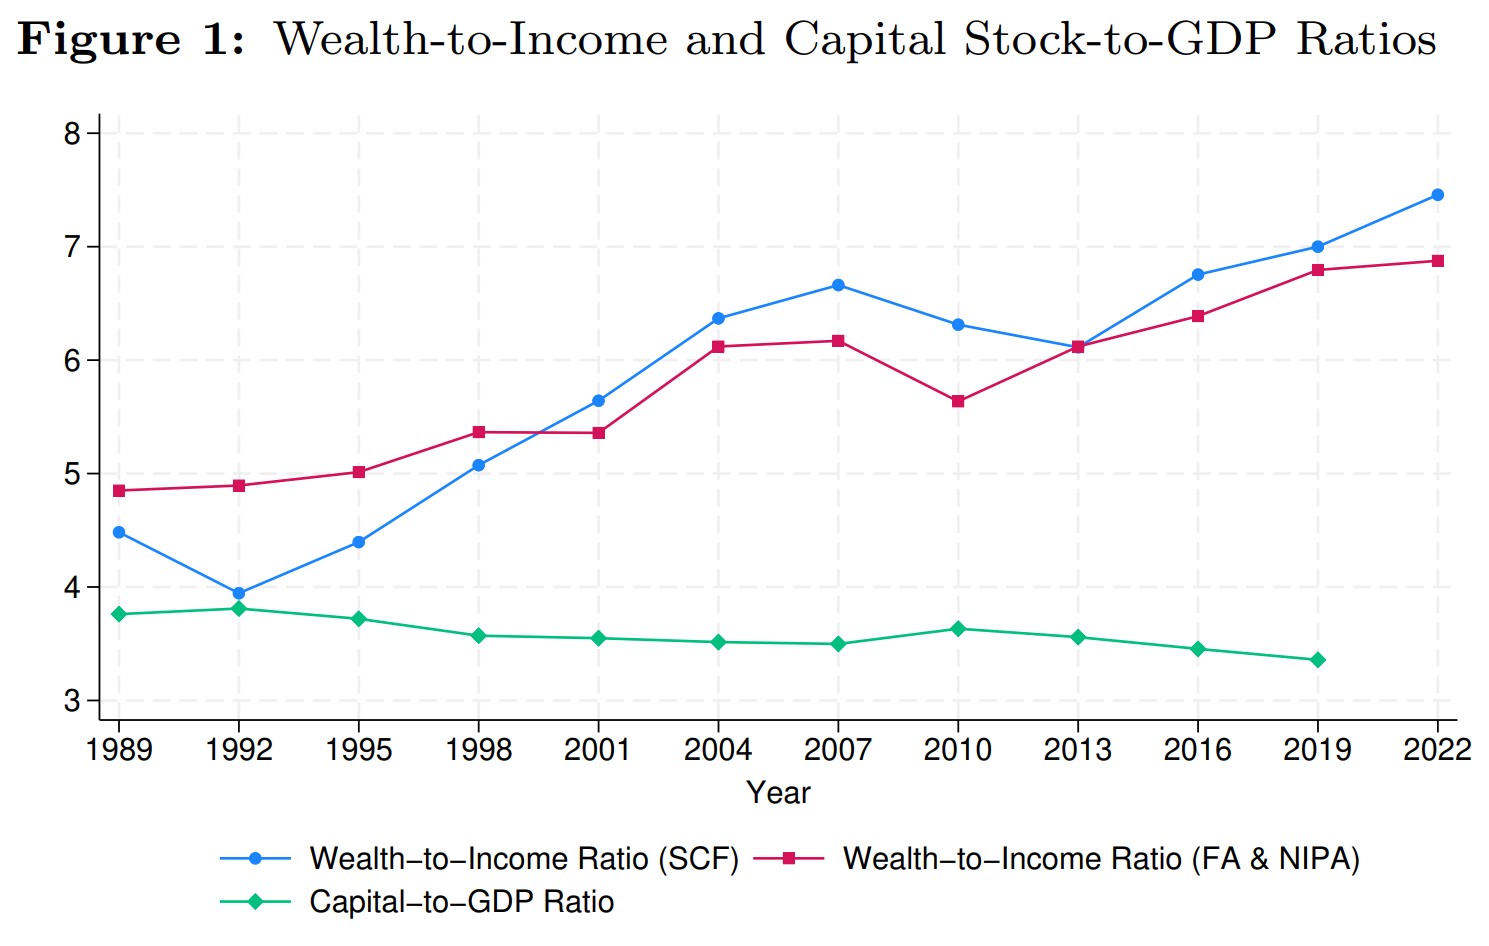
Data on the three financial situations reveal divergent growth patterns: while average earnings increased by 36% and income by 46% over the past three decades, wealth grew by 143%. This substantial difference suggests that wealth accumulation has been driven more by asset price appreciation than by savings from income. As shown in Figure 1, the wealth-to-income ratio based on SCF data almost doubled from about 4 in 1989 to over 7 in 2022. A similar but less pronounced trend appears when using Financial Accounts and National Income data. In contrast, the capital-to-output ratio from the Penn World Table remains relatively constant over this period. This striking difference highlights that asset price appreciation – not accumulation of physical capital – has been the primary driver of wealth growth.
Wealth concentration at the very top
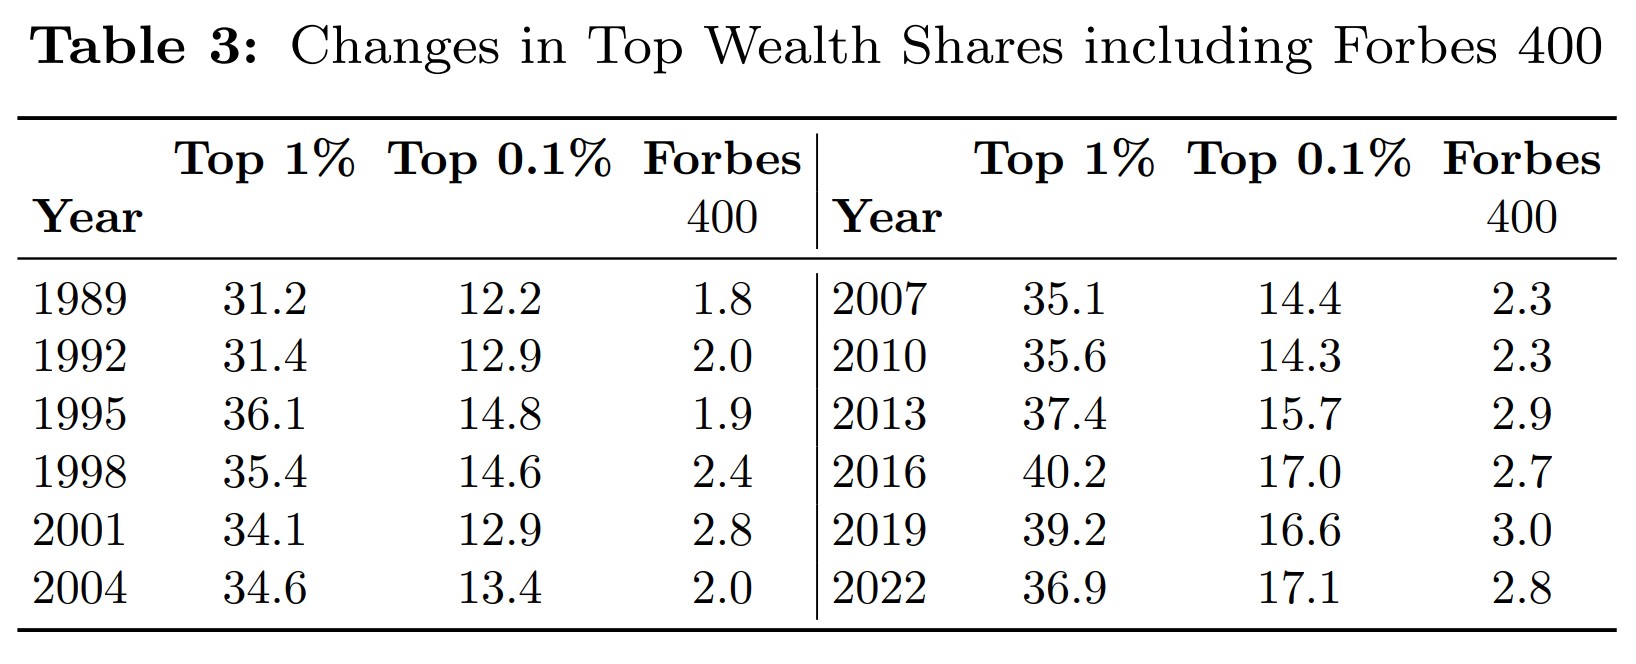
While the SCF excludes the Forbes 400 (the wealthiest 400 Americans), incorporating their wealth from Forbes Magazine estimates reveals interesting patterns. A recent decline represents a potential inflection point in the long-term trend of rising wealth concentration. As shown in Table 3, their share of total household wealth increased from 1.8% in 1989 to a peak of 3.0% in 2019 before slightly declining to 2.8% in 2022. The top 1% wealth share (including the Forbes 400) followed a similar pattern rising from 31.2% in 1989 to 40.2% in 2016, before falling to 26.9% in 2022.
Changes in distribution measures
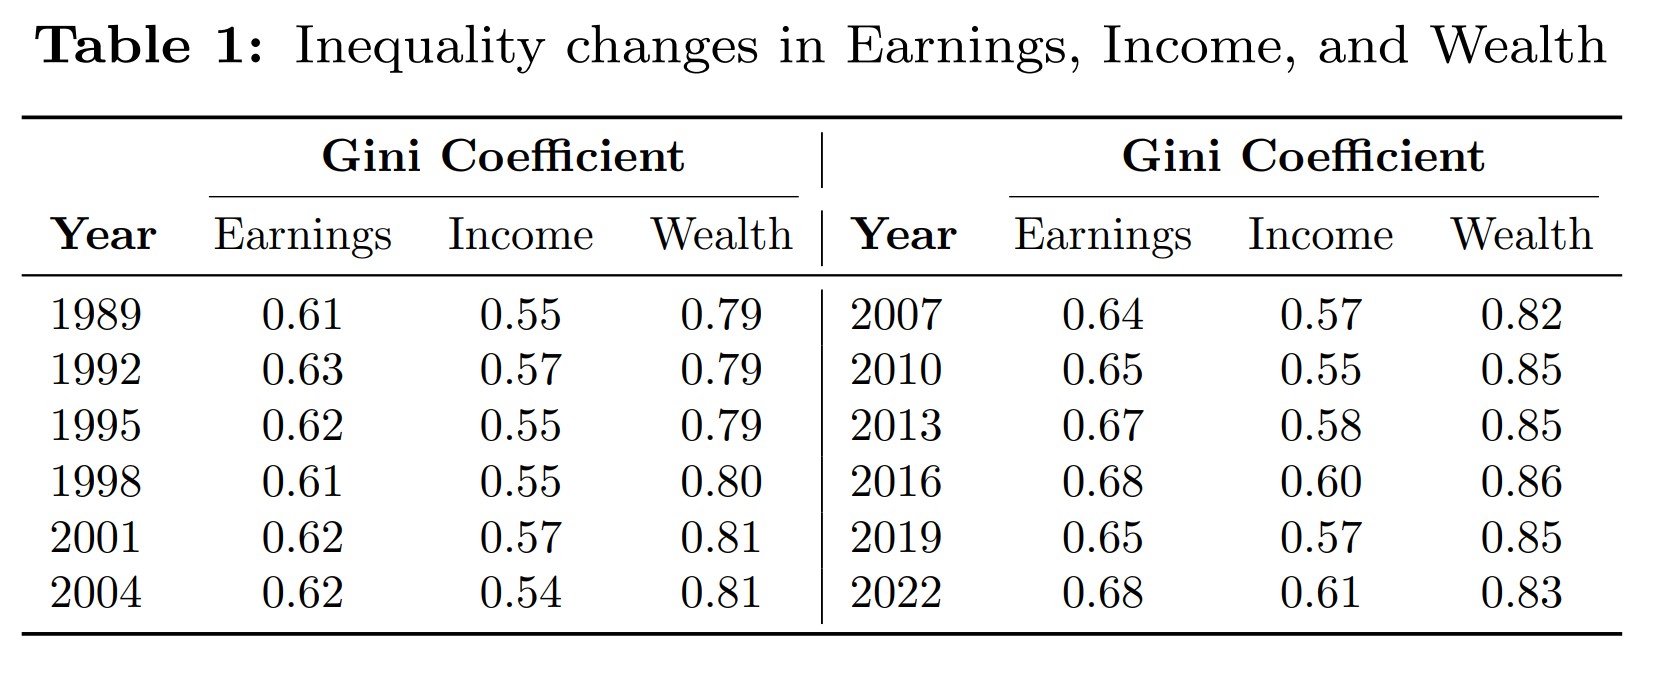
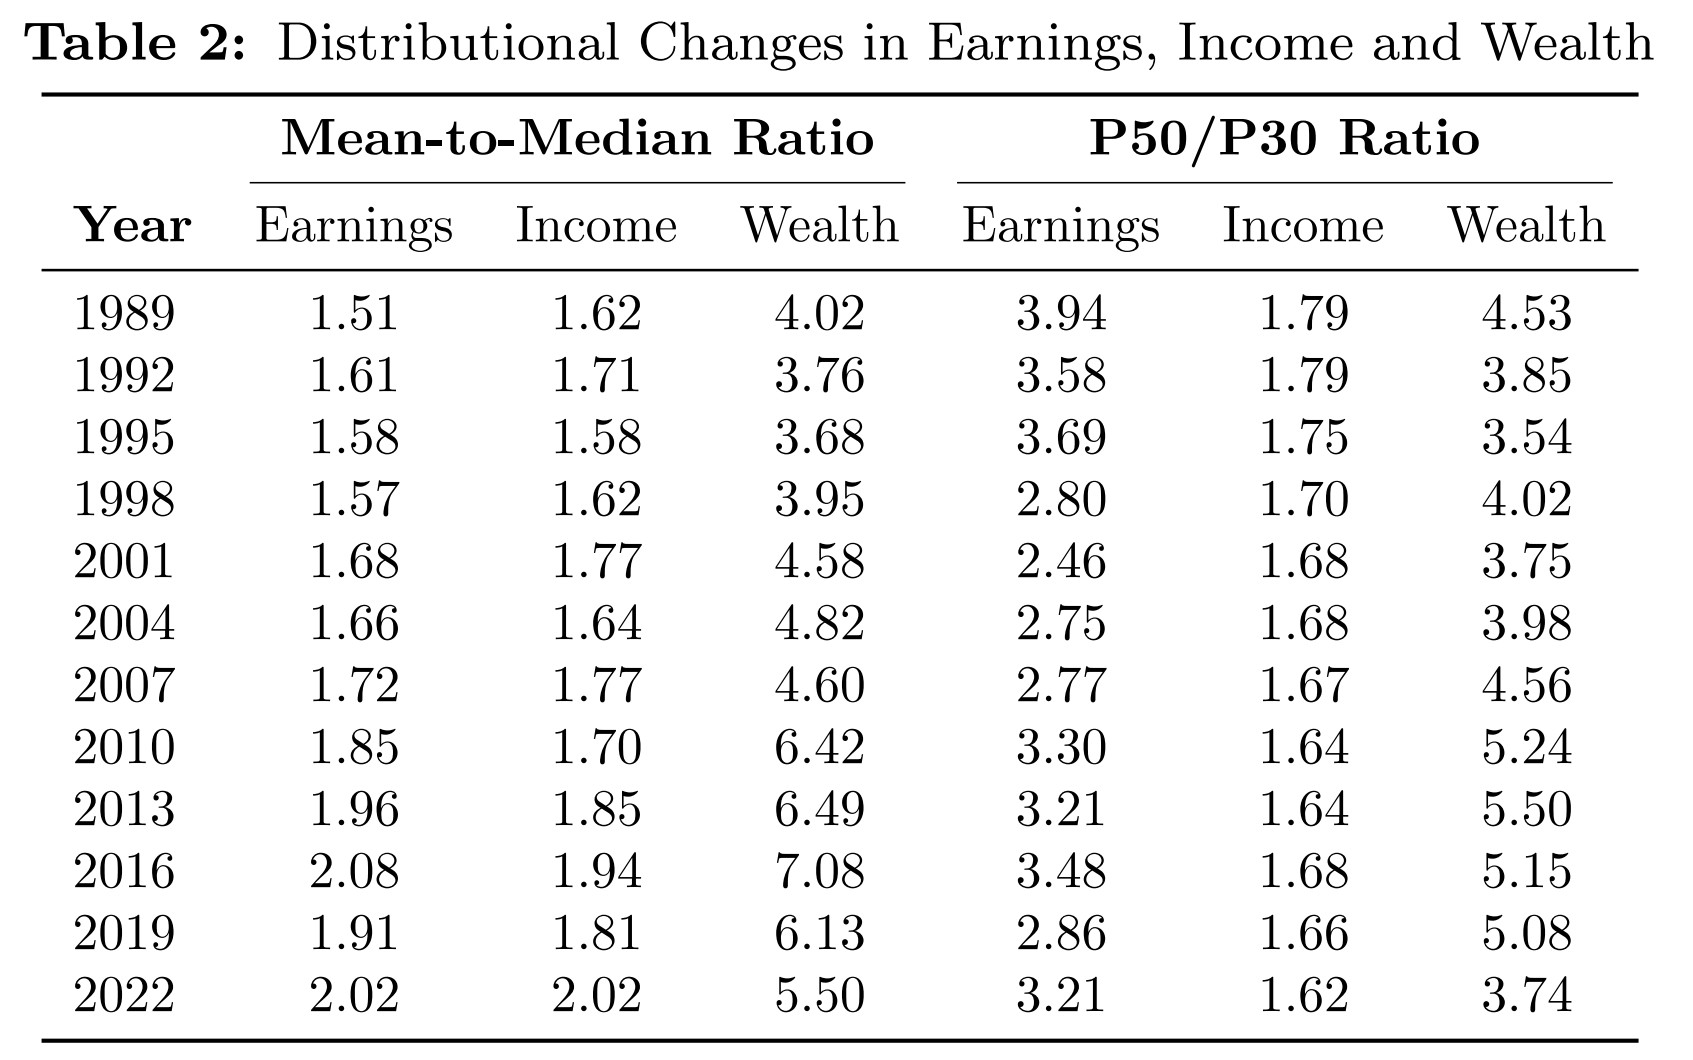
Gini coefficients show a secular increase in inequality across all three variables until 2016. For wealth, the increase is most pronounced after the 2008-09 financial crisis, while earnings and income inequality rose more gradually. After 2016, wealth inequality notably declined. The mean-to-median ratios and percentile ratios in Table 2 reveal that the top of all distributions moved further from the middle over time, while the 50-30 ratio show that the bottom moved closer to the middle, creating an asymmetric stretching of the distributions.
References
Kuhn, Moritz, and José-Víctor Ríos-Rull (May 2025). Income and Wealth Inequality in the United States: An Update Including the 2022 Wave.