
Age and Inequality
Using 2022 Survey of Consumer Finance data, this page compares earnings, income, and wealth across age groups. It traces how resources and sources of income change over the life cycle and measures the degree of inequality within each age group.
Earnings, Income, and Wealth over the life-cycle
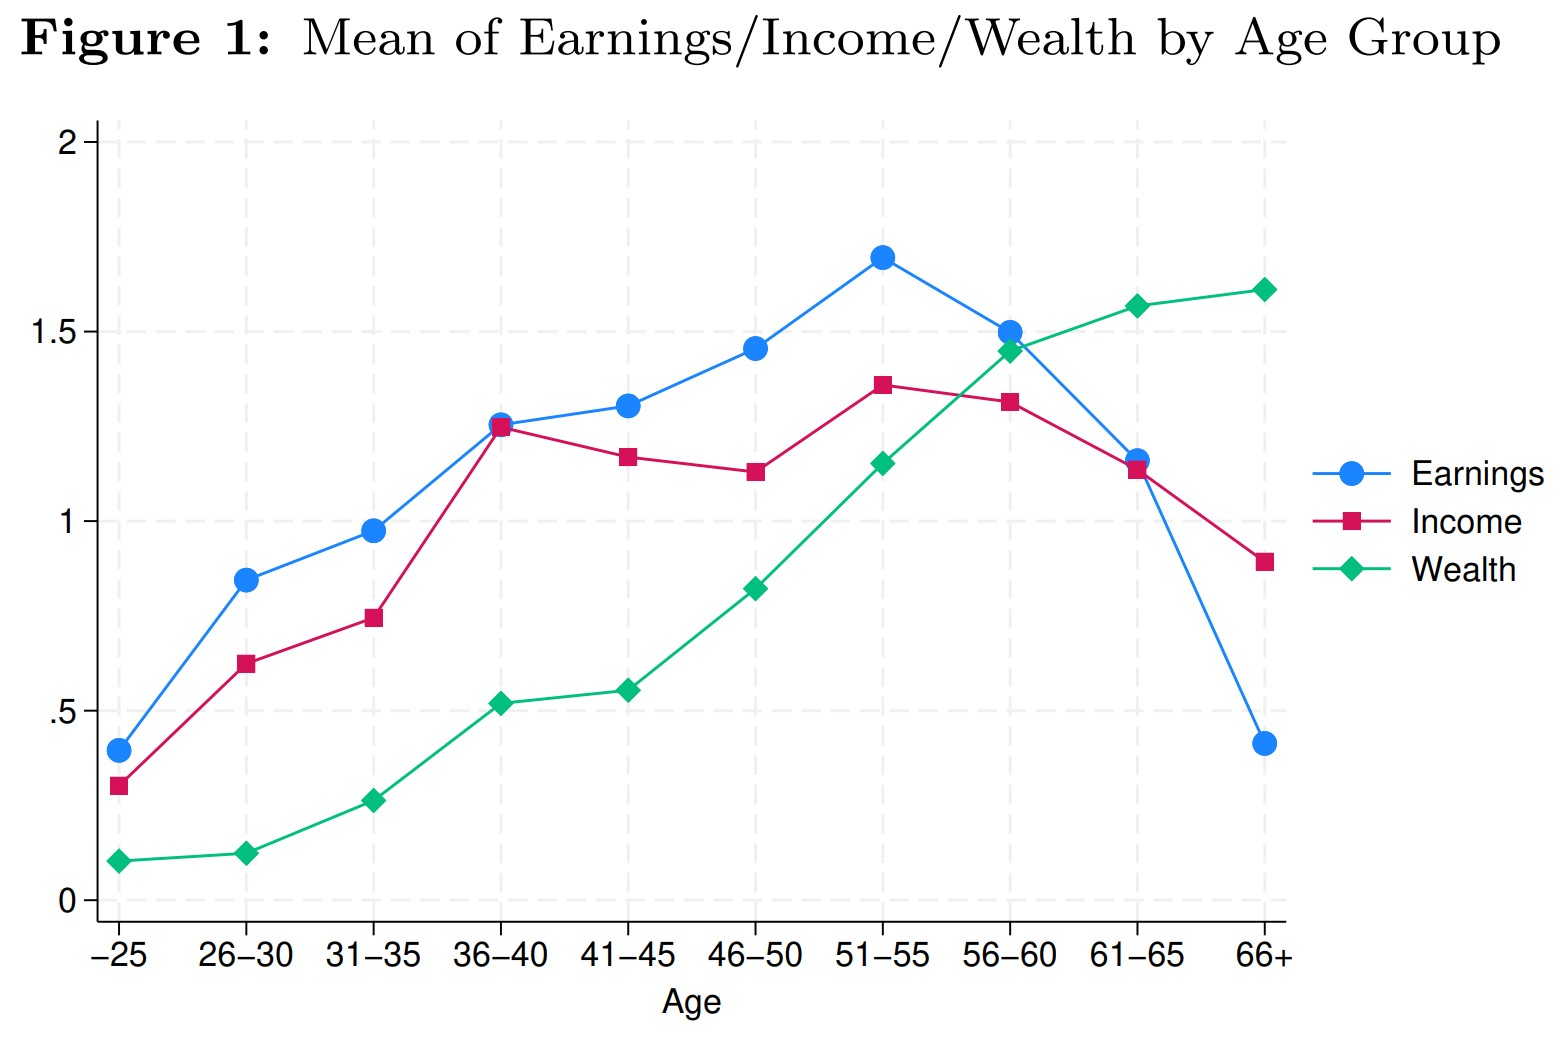
Figure 1 shows how earnings, income, and wealth change throughout life. To make the different patterns easier to compare, each measure is scaled so that its average value equals 1. Earnings and income follow similar paths, rising during working years before declining later in life, while wealth grows much more steadily with age. Households under age 25 earn and receive about half the life-cycle average. Earnings and income then increase gradually, reaching their highest levels, around 150% of the average, between ages 51 and 55. This means that financial resources roughly triple between ages 25 and 55. After age 55, earnings and income begin to fall as people retire and reduce their participation in the labor market, with a particularly sharp decline after age 65.
Wealth follows a markedly different pattern. Households begin with minimal wealth, but accumulation continues throughout life, reaching approximately 1.5 times the life-cycle average for the 66-and-older group. Importantly, wealth does not decline in older age groups, suggesting that retirees, on average, do not substantially draw down their accumulated assets.
Income sources by age groups
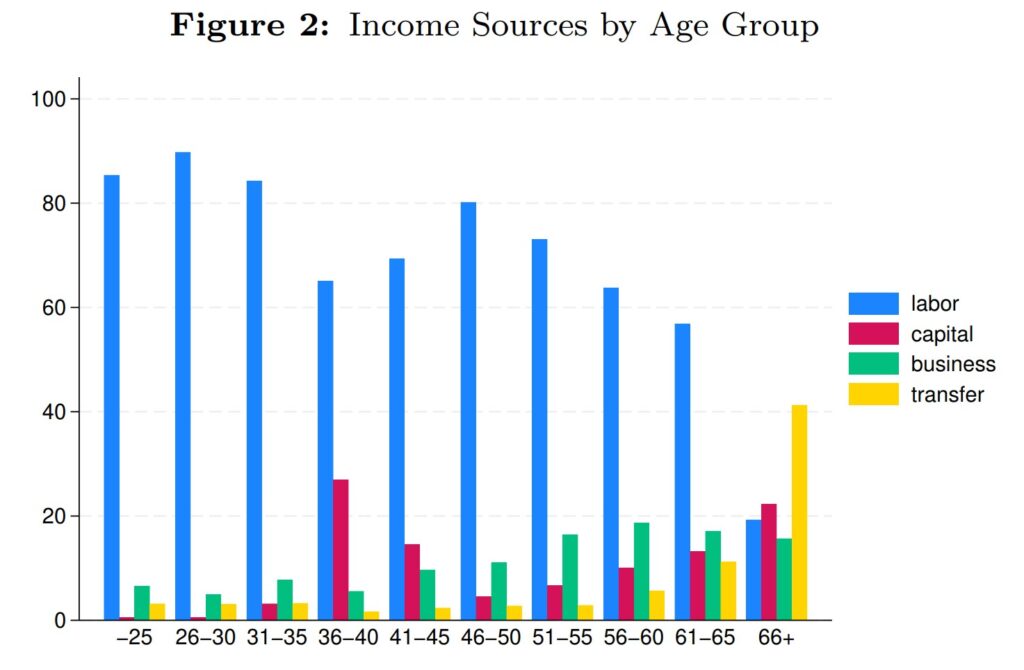
Figure 2 decomposes income by source across age groups, revealing two clear patterns. First, labor income dominates for younger households but becomes progressively less important with age, not because earnings decline as shown in Figure 1, but because other income sources grow more rapidly, particularly capital and business income. Second, transfer income remains relatively stable during most working years but rises sharply after age 60 as more households enter retirement and begin receiving pensions and other benefits.
Within age-group inequality
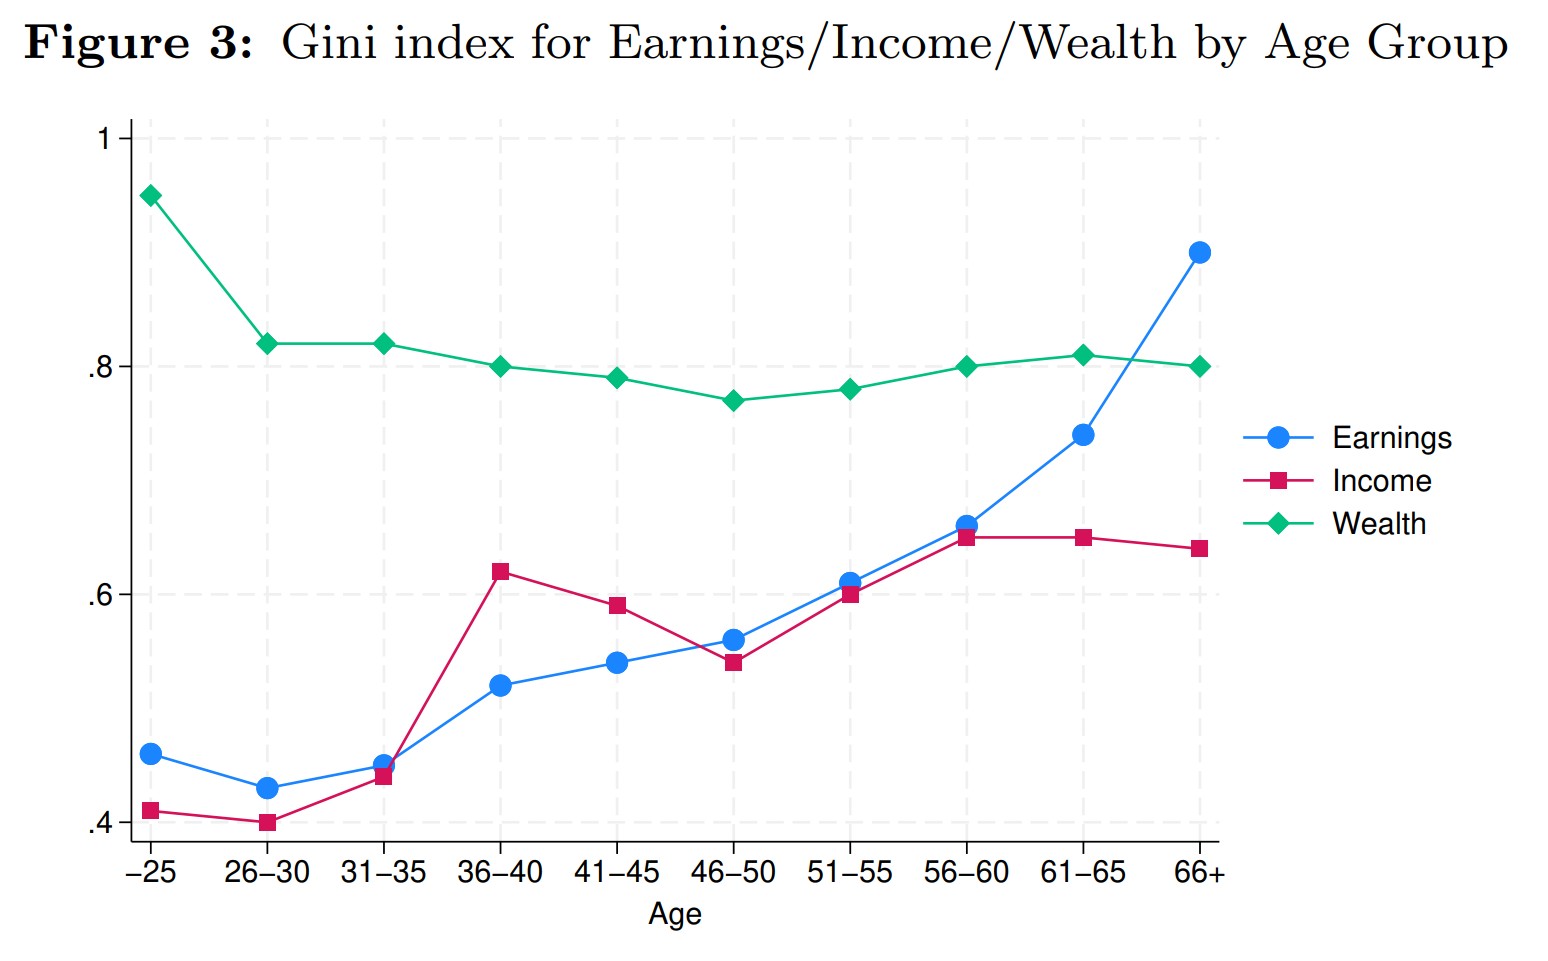
While the life-cycle profiles demonstrate substantial between-group differences, Figure 3 examines within-group inequality by displaying Gini coefficients for each age group. Within-group inequality for earnings and income increases systematically with age. By contrast, wealth inequality remains high across all age groups, with Gini coefficients consistently above 0.75.