

Income and Wealth Inequality
This page draws on the paper Income and Wealth Inequality in the United States: An Update Including the 2022 Wave by Moritz Kuhn and José-Víctor Ríos-Rull to provide a detailed picture of the financial position of U.S. households. The results collected here show how earnings, income, and wealth are distributed, how inequality has evolved since 1989, and how financial outcomes differ across age, education, employment, and family structure. The page also examines why households save and provides access to the underlying tables and data.
Use the links below to explore the findings by topic.
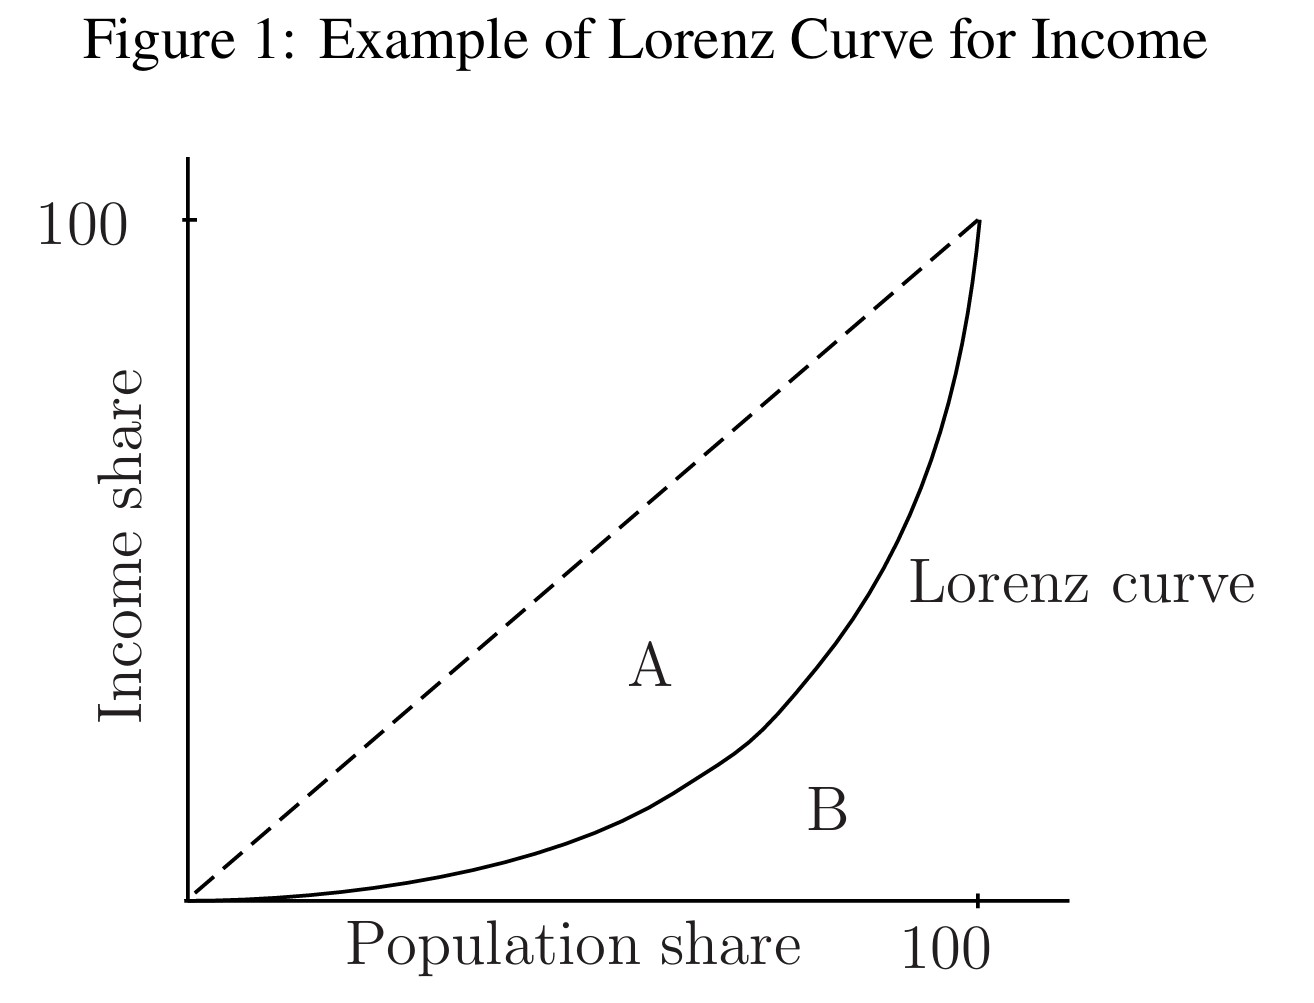
How inequality is measured
Different measures reveal different features of inequality. The Gini coefficient summarizes overall concentration, while percentile ratios and other statistics show what is happening at the bottom, middle, and top of the distribution. Together, they provide a more complete picture than any single number.
Explore how inequality is measured →
Why households save
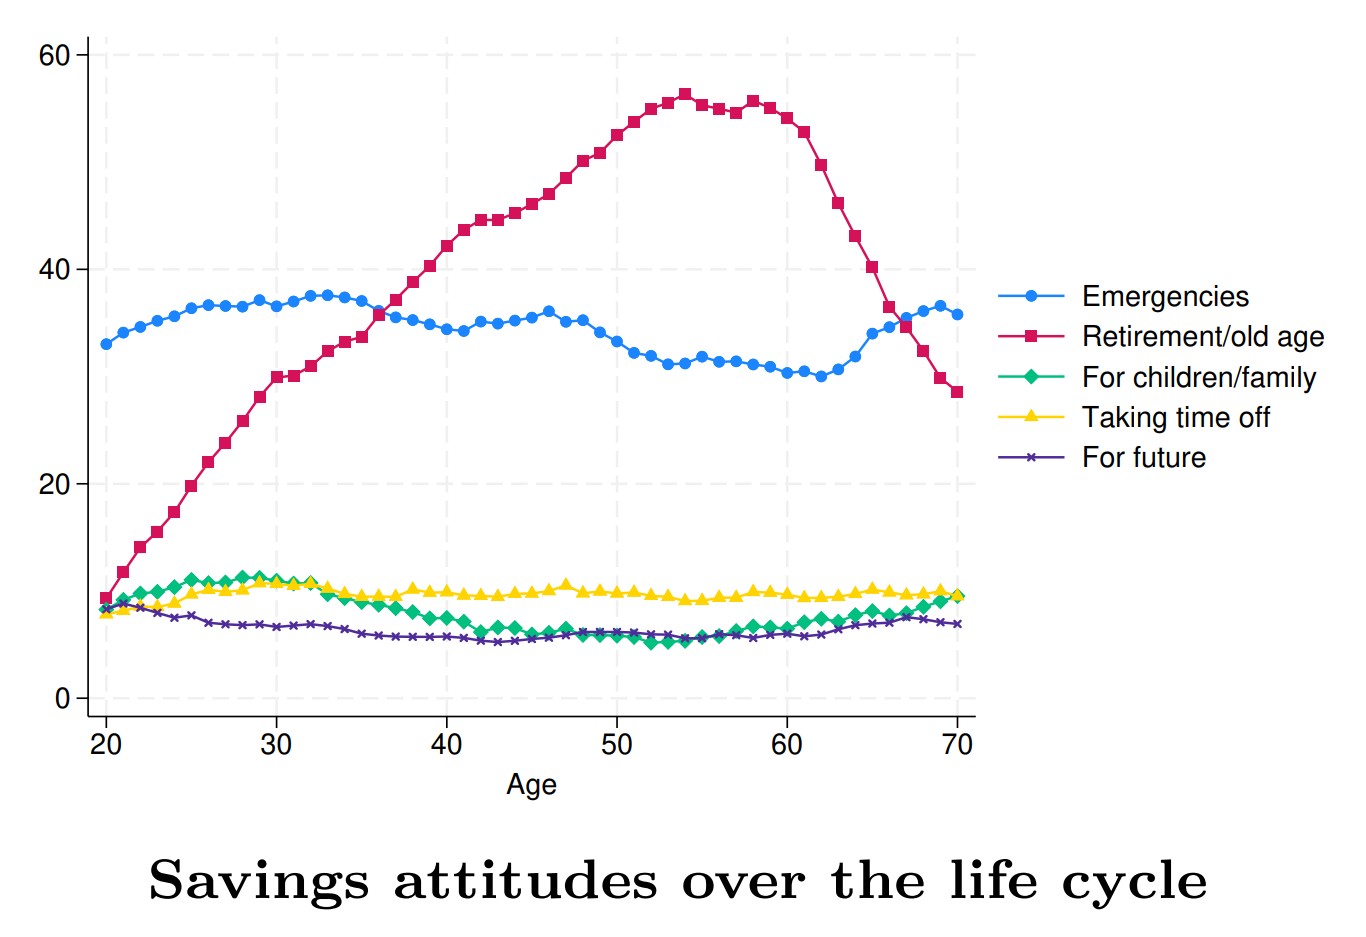
Emergencies and retirement are the two leading reasons households save, but their importance varies across the life cycle. Retirement saving rises toward middle age, while emergency saving becomes more prominent again later in life and matters especially for less-wealthy households.
Explore how saving motives vary across households and age →
Earnings, income, and wealth inequality
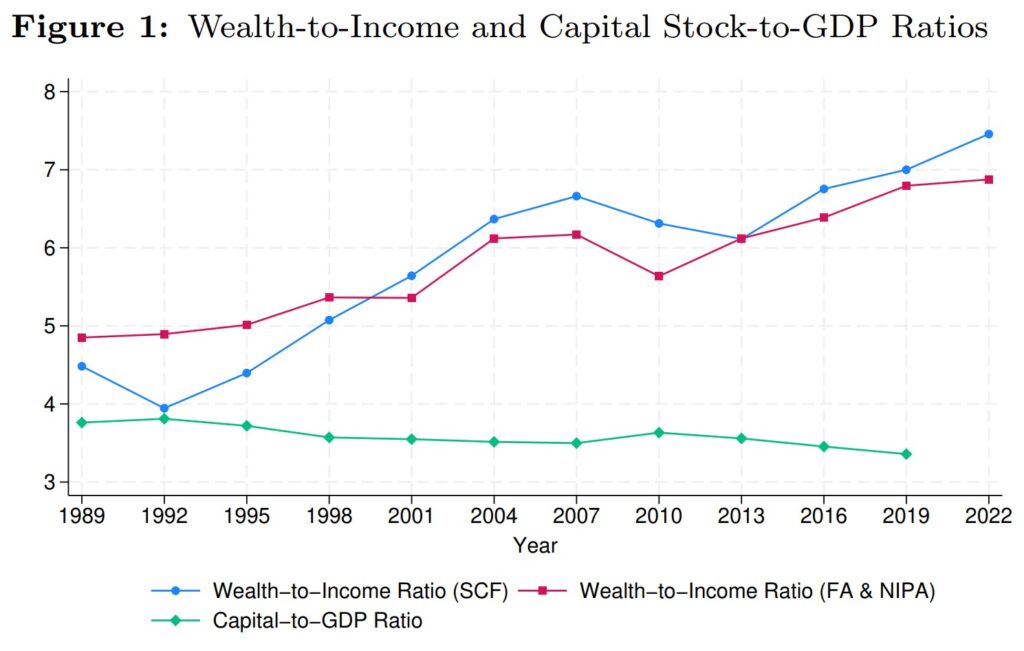
Over the past three decades, wealth has grown far faster than earnings or income, driven primarily by asset price appreciation rather than savings. Asset price appreciation – not accumulation of physical capital – has been the primary driver of wealth growth.
Explore long-run trends in earnings, income, and wealth →
Income inequality
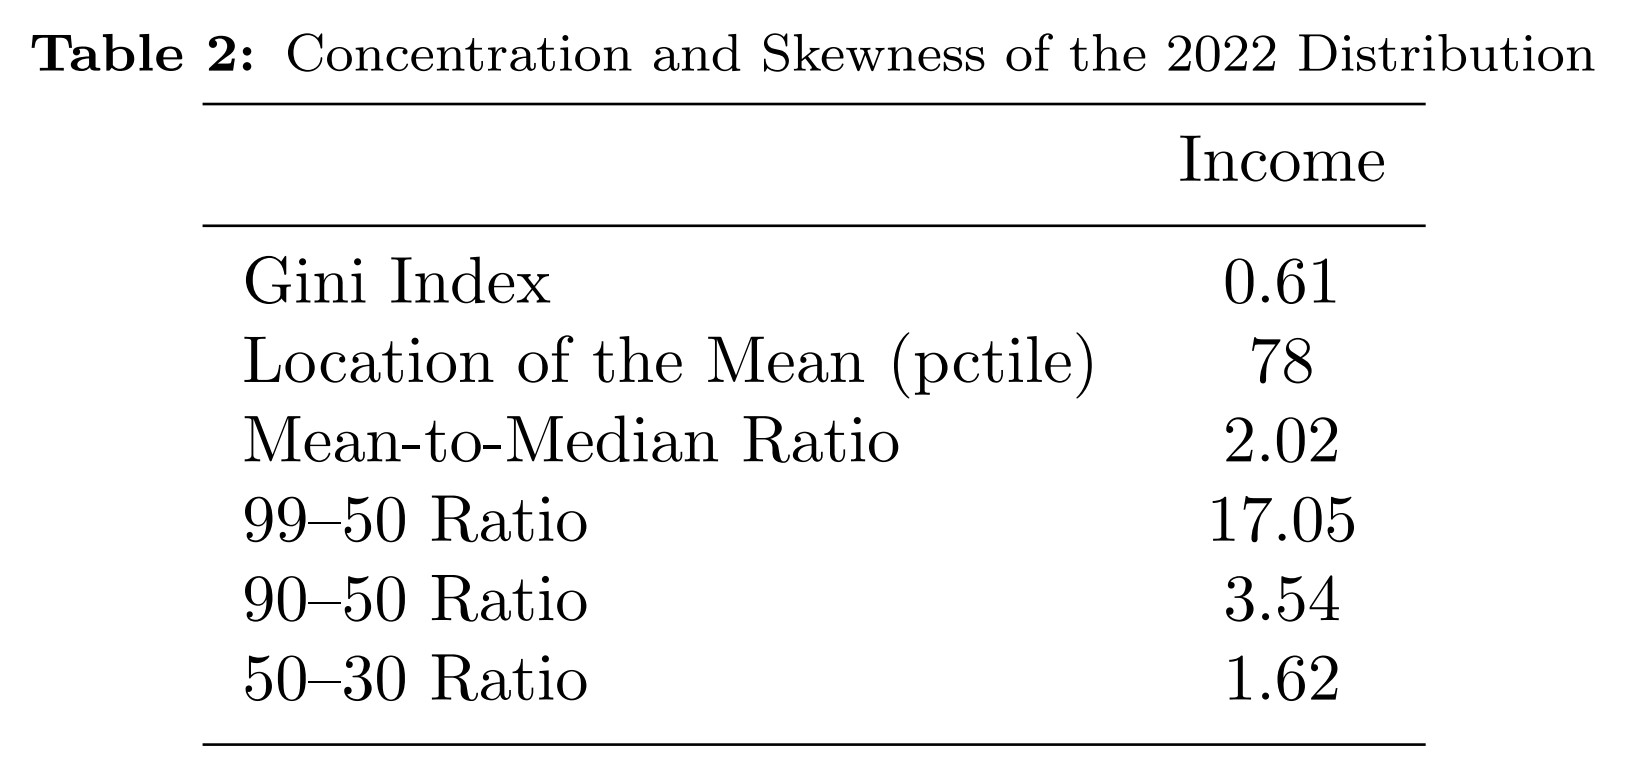
U.S. income is sharply skewed. The median household receives about $70,000, while the mean is twice as high and sits at the 78th percentile. The threshold for the top 1% is nearly $1.2 million – about 17 times the median.
Explore how income is distributed across U.S. households→
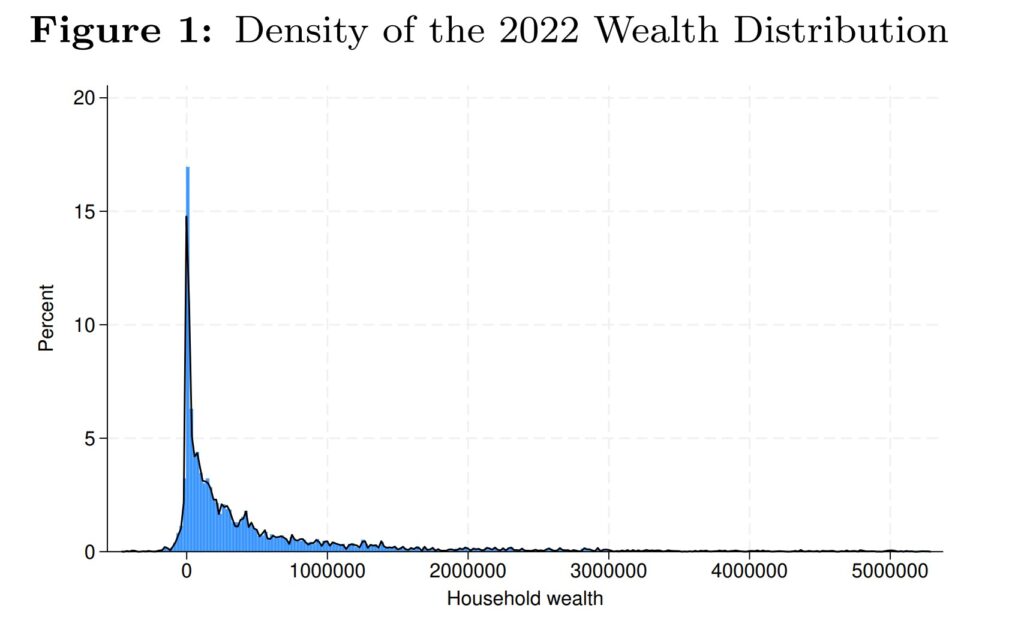
Wealth inequality
Wealth is even more concentrated than income. Nearly one in ten households has negative wealth, while the median holds about $193,000. Entering the top 1% requires roughly $13.6 million – more than 70 times
Explore the scale and structure of U.S. wealth inequality →
Family, Children, and Inequality
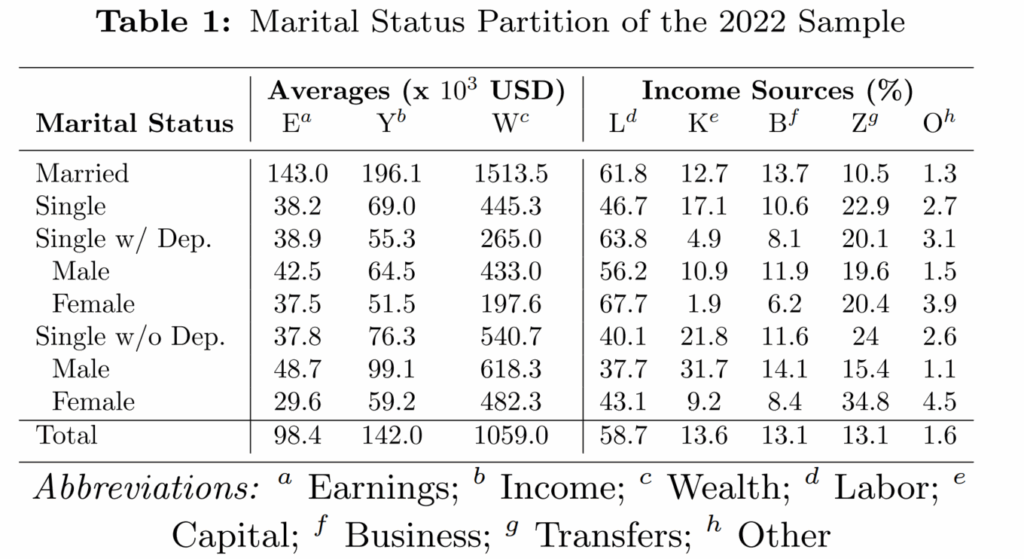
Married households hold roughly three times the resources of single households. Singles with dependents – especially women – face the greatest financial constraints, while much of the apparent relationship between children and income reflects differences in age and family structure.
Explore how marital status and family structure shape household finances →
Employment, occupation, and inequality
Employed households receive about twice the income of households headed by someone unemployed. Wealth is less straightforward: out-of-labor-force households include both asset-rich retirees and people with limited resources. Across occupations, income gaps only weakly predict wealth gaps.
Explore how work and occupation shape household finances →
Age, the life cycle, and inequality
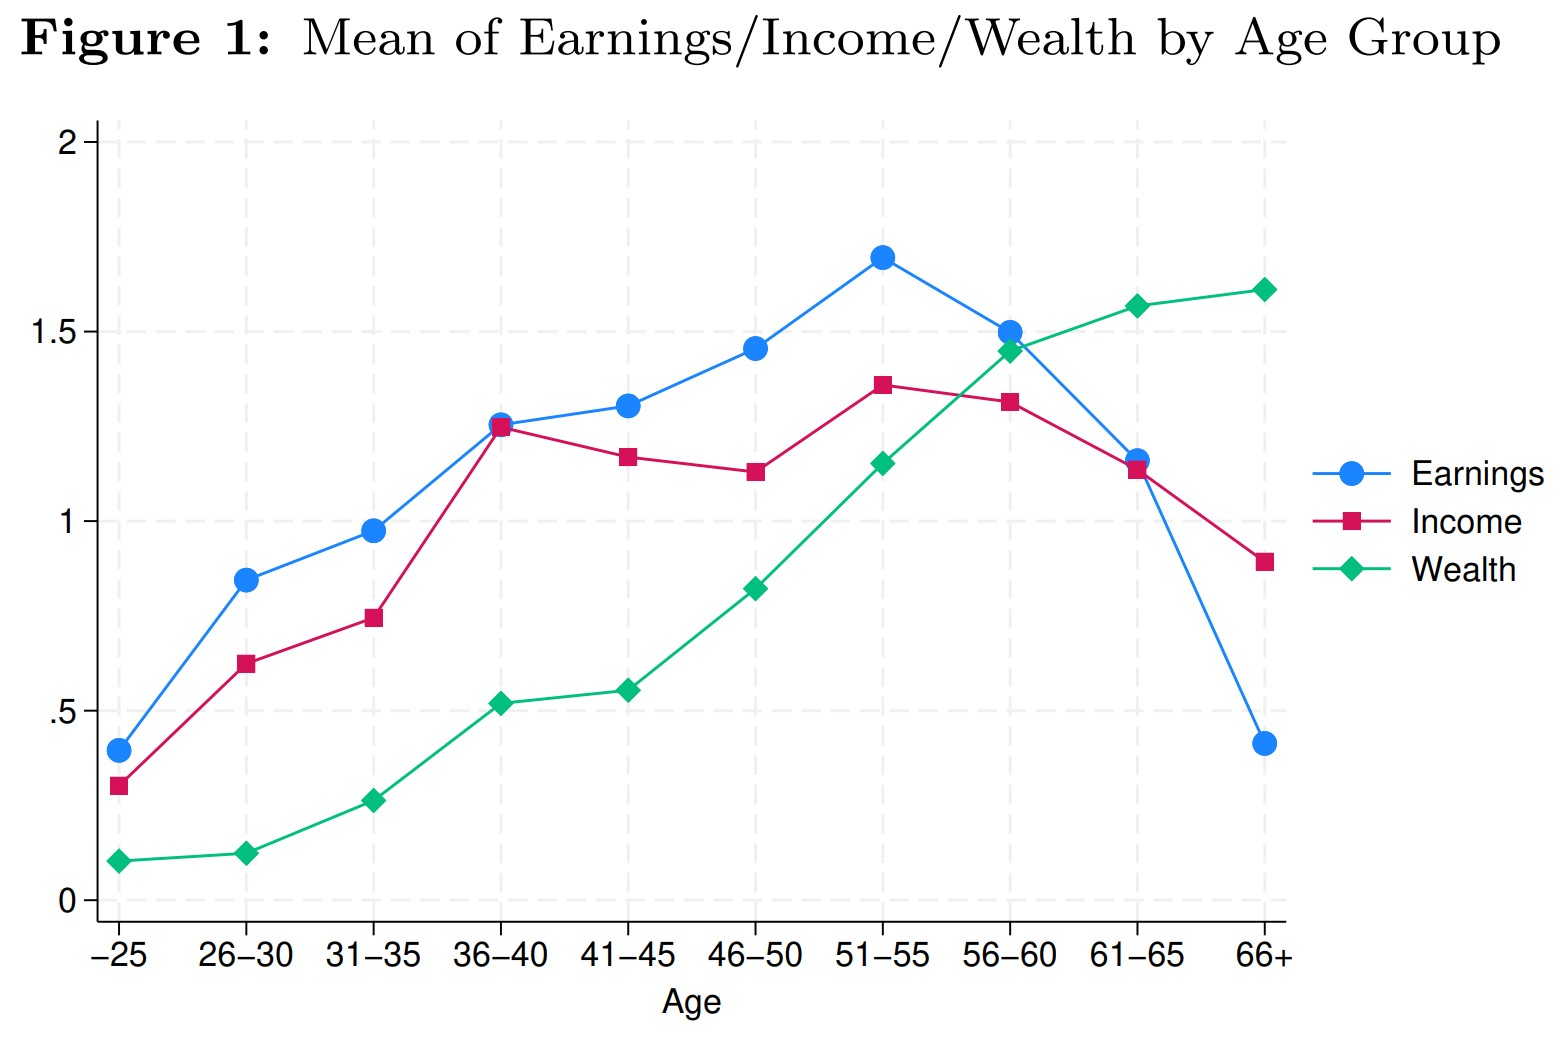
Earnings and income rise through the working years, peak around ages 51-55, and fall near retirement. Wealth follows a different path, accumulating steadily into older age. Yet wealth remains highly unequal within every age group.
Explore how earnings, income, and wealth vary across age groups →
Education and household finances
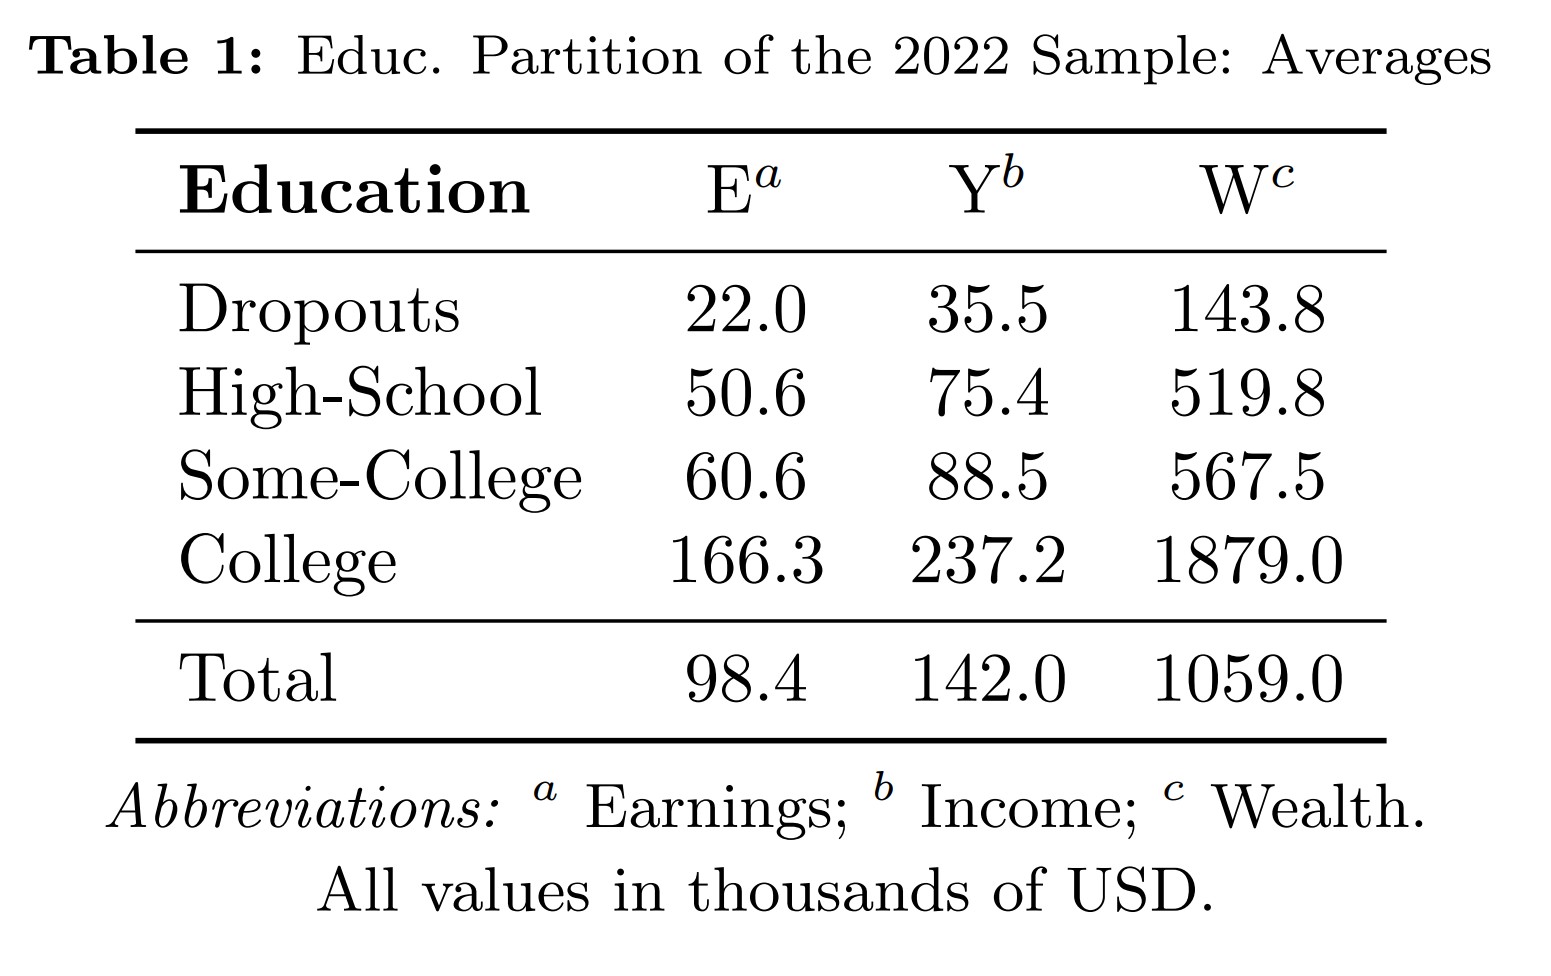
Financial outcomes rise strongly with education, with the largest gains after college completion. College graduates average nearly seven times the income and thirteen times the wealth of high-school dropouts. Still, substantial inequality remains within every education group.
Explore how education shapes earnings, income, and wealth →
Data
The Excel workbooks below contain results for all waves of the Survey of Consumer Finances (SCF) from 1989 through 2022. All dollar amounts are expressed in 2022 dollars. For more information on the Survey of Consumer Finances (SCF) data please visit Federal Reserve Board – Survey of Consumer Finances (SCF)
Distributions of earnings, income, and wealth
Earnings partitions
Average earnings, income, and wealth
Shares of aggregate earnings, income, and wealth
Income-source decomposition
Age composition
Education composition
Employment composition
Marital-status composition
Marital status excluding retired widows
Assets and debts: housing/cars, business/nonfinancial, financial assets, collateralized and uncollateralized debt
Income partitions
Average earnings, income, and wealth
Shares of aggregate earnings, income, and wealth
Income-source decomposition
Age composition
Education composition
Employment composition
Marital-status composition
Marital status excluding retired widows
Assets and debts: housing/cars, business/nonfinancial, financial assets, collateralized and uncollateralized debt
Wealth partitions
Average earnings, income, and wealth
Shares of aggregate earnings, income, and wealth
Income-source decomposition
Age composition
Education composition
Employment composition
Marital-status composition
Marital status excluding retired widows
Assets and debts: housing/cars, business/nonfinancial, financial assets, collateralized and uncollateralized debt
Joint distributions of earnings, income, and wealth
These workbooks cross-tabulate households by deciles of two economic measures. Select a distribution below, then choose a survey year.
Each workbook contains two sheets. “Probabilities” reports the weighted percentage of households in each 10 × 10 cell. “Means” reports average earnings, income, and wealth for the households in each cell.